Robust and High-Yield: Office Markets in Second-Tier Cities
Robust and High-Yield: Office Markets in Second-Tier Cities
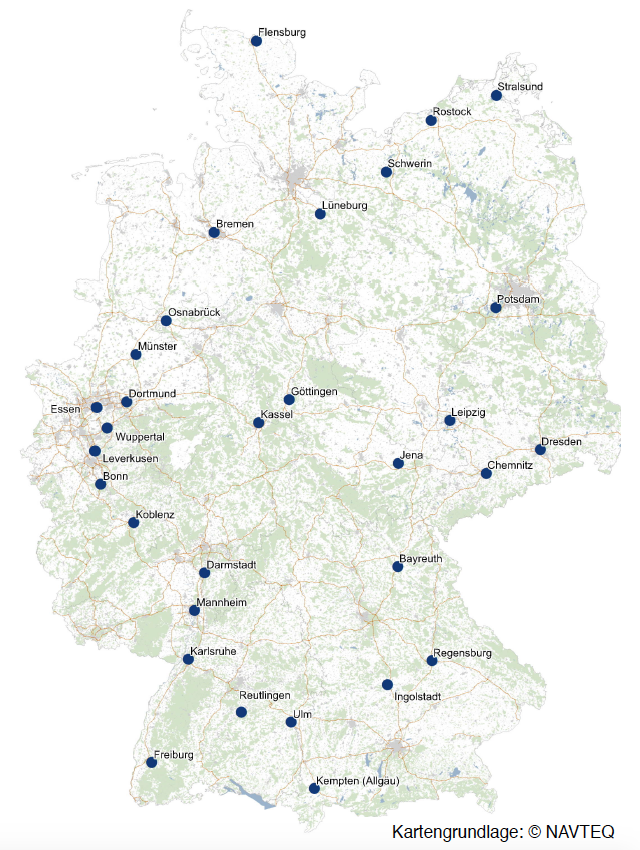
Once again, we studied the investment opportunities in 31 second-tier cities for DEMIRE. At the same time, we introduced the all-new Secondary Office Index (SOX): The new index will provide guidance to investors beyond the dated ABBA formula. Finally, we will also tell you which German cities have the best risk-return ratio.
Office markets in smaller cities are less susceptible to dips in the business cycle. In fact, the real estate markets of the second-tier cities are characterised by a large number of so-called hidden champions and a strong mid-market sector. Aside from the fact that the often regionally rooted companies tend to be loyal tenants, there is almost a complete absence of construction on speculation (rather than in response to actual need).
The SOX illustrates that second-tier cities, when compared to the “Big Seven” cities, have market growth potential despite their superior stability during periods of decline. For investors who are thoroughly familiar with the market and who have the wherewithal to manage a broadly diversified real estate portfolio, second-tier cities still offer serious investment alternatives even in the current market cycle.
Examining 31 selected cities, the survey takes a closer look at the trends in office rents, office vacancies, office employment and office take-up while also studying construction activity and liquidity in each market during the years 2009 through 2018.
Here are the key findings:
Investment Market
On the commercial investment market, office real estate remained the most sought-after asset class in 2018. It is in this asset class that roughly 52 % of the commercial property investments were transacted. The persistently keen demand—in a time of limited supply—has sent net initial yields on a nosedive, down to new all-time lows. In addition to Class A cities, the focus of investors has lately shifted to include second-tier cities. In 2018, these attracted c. 23 billion euros in investments. The aspects that make such second-tier cities a winning proposition are higher yields combined with more stable rent rates.
Risk / Return Representation
In the present survey, the Class A markets and secondary markets were also studied with respect to their stability of income and the achievable return on investment. It reveals that every one of the second-tier cities examined has a higher yield upside than the Class A markets. The bracket of achievable net initial yields extends from 4.0 % in Bonn and Freiburg to 6.7 % in Stralsund. By contrast, the weighted average net initial yield achieved in Class A cities at the moment is around 2.97 % only.
The stability of income in most of the second-tier cities is also reflected in a rent volatility: Dortmund, for instance, has a very low spread of average rents, which minimises the risk of rent corrections on the market side. Conversely, Class A cities like Berlin and Munich—but also places like Kempten and Leipzig—combine market fluctuations with a comparatively high rent volatility.
To put the return potential and the earnings risk in relation, a quotient of yield and volatility was created. It is represented in the table below.
As the chart suggests, cities like Bonn and Dortmund have very favourable relations, whereas the Class A cities (Berlin, Munich and Hamburg) but also the second-tier city of Leipzig range at the bottom of the list because of their massive rent fluctuations.
Trend in Average Rents
The robust economic situation has resulted in job growth—and office employment benefited from the trend more than other categories. The subsequent rise in office space requirements is also reflected in upward rental growth. Apart from the Class A cities, the second-tier cities achieved substantial rent increases in their own right during the analysis period.
Trend in New Office Completions
Second-tier cities tend to be characterised by a demand-driven volume of new construction. Speculative construction projects—meaning developments pursued without forward commitments—have become the exception. This ensures a balanced relation of supply and demand, and therefore helps to prevent market upheavals.
Trend in Vacancies
The vacancy rate is an important indicator for the condition of a given office market. In the wake of the robust economic development and the growth in office jobs, many office markets report full occupancy now, and not just Class A cities like Munich or Berlin but even second-tier cities. Due to the demand-driven building activity in the second-tier cities, there is no reason to expect the strain on the regional office markets to ease in the coming years.
Trend in Office Employment
The economic growth of the past few years has fuelled the creation of new white-collar jobs in Germany. In the time between 2009 and 2018, the Class A cities registered a growth of around 20 %. Some of the second-tier cities generated even faster growth. And the years to come are projected to bring a further increase in office jobs in virtually all second-tier cities. The currently strained situation on the office markets—with their low supply of office accommodation—could therefore tighten further.
Trend in Office Take-up
The office take-up is an indicator for the attractiveness and activity of a given market. The booming economy has pushed demand for office space both in the Class A cities and in many secondary markets to a high level. The ramifications are obvious when looking at the vacancy rate which lately dropped well below the fluctuation reserve as a result of the sluggish building activity of recent years. The pent-up demand has led in turn to an upward rental trend.
Note: To download the full-length survey, please go to http://www.demire.ag/immobilien/research.
Contact person: Sven Carstensen, Division Head Office and Investment Markets at bulwiengesa, carstensen [at] bulwiengesa.de


